‘Tis the season! It is time once again for J.D. Power’s airport rankings, and the 2024 results highlight a clear trend: rising costs and record crowds are beginning to impact traveler spending. Despite this, overall satisfaction remains remarkably high.
The J.D. Power 2024 North America Airport Satisfaction Study is out, and it reveals some shakeups on the leaderboard (we see you, MSP!). Perhaps confoundingly, traveler satisfaction remains strong despite record passenger volumes, including a single-day record of three million travelers on 07 July, and soaring prices for goods and services.
“Most travelers are still enjoying the experience,” says Michael Taylor, managing director of travel, hospitality, and retail at J.D. Power. “However, we are starting to see a breaking point in consumer spending, with average spend per person in the terminal declining significantly from a year ago.”
The J.D. Power 2024 Airport Satisfaction Study: Four Key Takeaways
J.D. Power highlights four major insights that shape this year’s rankings:
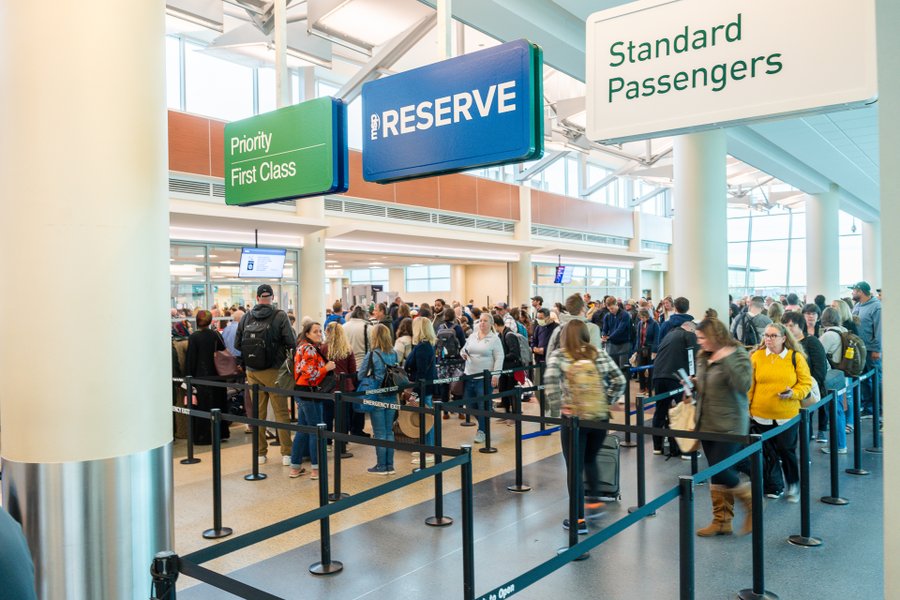
- Passengers still enjoy the airport experience: Despite crowded terminals, flight delays, and cancellations, most travelers continue to enjoy their time at airports.
- Skyrocketing prices cut into spending: Passengers are spending less at airports than in previous years, with average spending down by $3.53 per person compared to 2023. That number jumps to $6.31 for large airports.
- Sense of place matters: Seventy percent of travelers feel their airport reflects the local culture or region, a factor that strongly influences the high scores of top-ranked airports.
- Crowded conditions hurt rankings: Only five percent of respondents reported experiencing “severely crowded” airports in 2024, but those airports saw a significant decline in their rankings.
Passengers Rate Their Experience Based on Seven Factors
The 19th annual study draws from 26,290 surveys completed by U.S. or Canadian travelers between August 2023 and July 2024. Participants must have used at least one U.S. or Canadian airport during a roundtrip (one-way flights excluded) to be eligible.
J.D. Power evaluates satisfaction levels at North America’s busiest airports, categorized into three groups: mega airports (over 33 million passengers per year), large airports (10 to 32.9 million passengers), and medium airports (4.5 to 9.9 million passengers).
For 2024, the study’s criteria have been updated and now focus on these seven factors:
- Ease of travel through airport
- Level of trust with airport
- Terminal facilities
- Airport staff
- Departure/to airport experience
- Food, beverage, and retail
- Arrival/from airport experience
Airports utilize this study’s insights to enhance their operations and the overall passenger experience.
Let’s take a look at the list of the top five best and worst airports in the mega, large, and medium categories, along with their survey scores (out of 1,000 points). Changes from the 2023 rankings are noted in parentheses after this year’s scores.
Mega Airports (>33 million pax annually)
Top 5
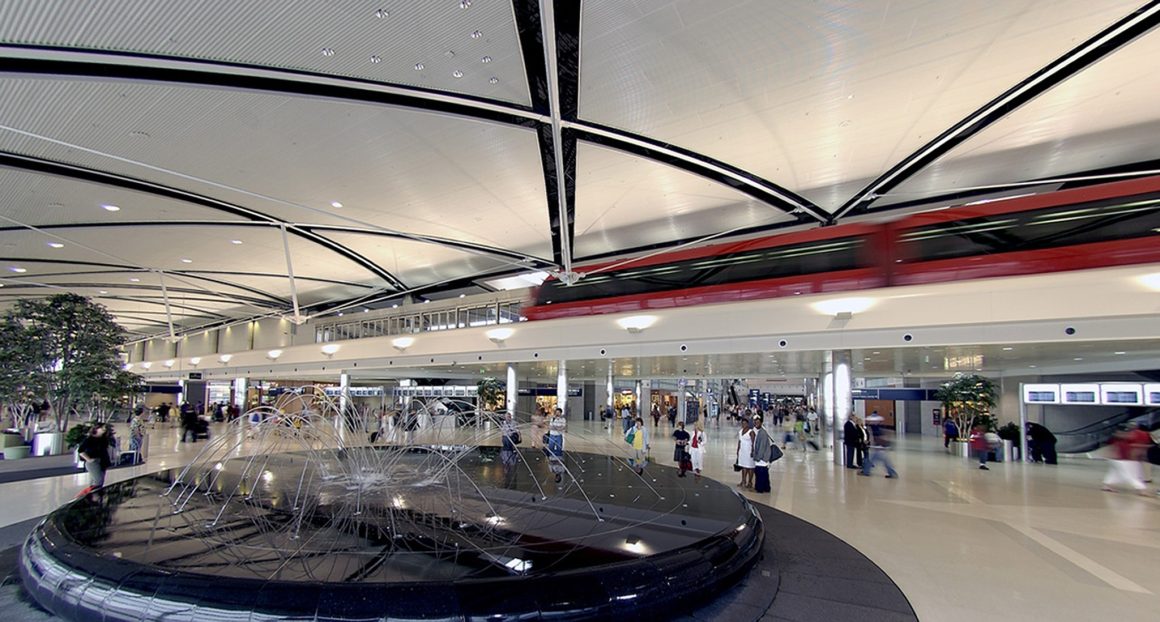
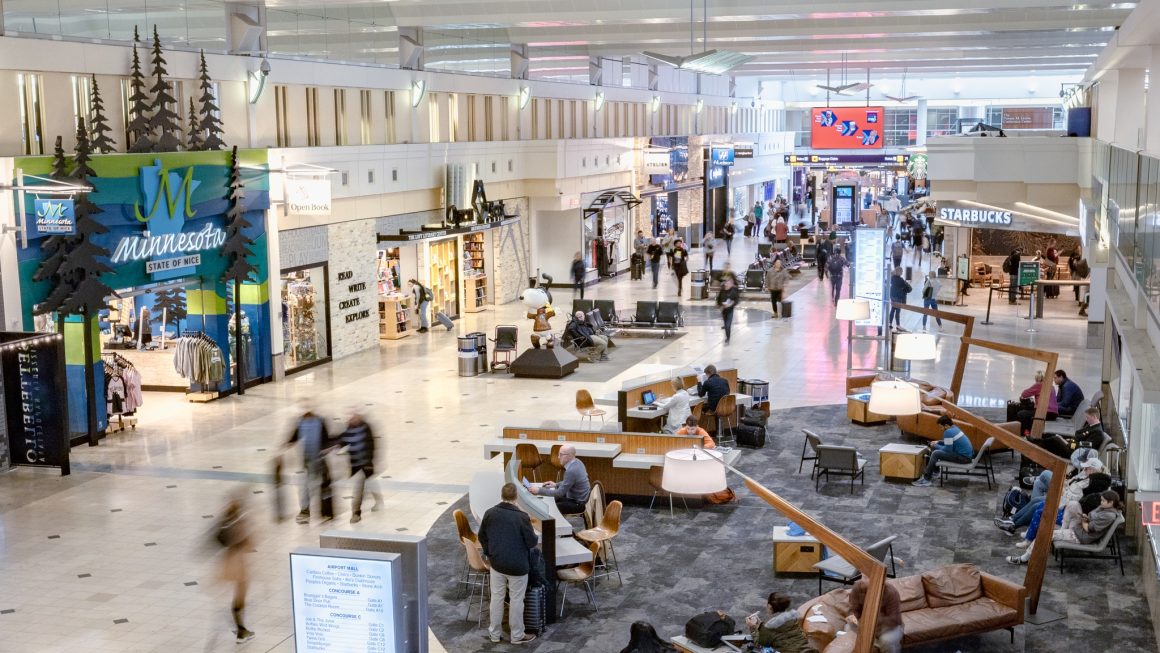
- MSP – Minneapolis-Saint Paul International Airport: 671 (+1)
- DTW – Detroit Metropolitan Wayne County Airport: 643 (-1)
- PHX – Phoenix Sky Harbor International Airport: 633 (+10)
- JFK – John F. Kennedy International Airport: 628 (+7)
- DFW – Dallas/Fort Worth International Airport: 623 (-1)
Bottom 5
- EWR – Newark Liberty International Airport: 552 (+/- 0)
- YYZ – Toronto Pearson International Airport: 559 (+/- 0)
- ORD – Chicago O’Hare International Airport: 569 (+3)
- ATL – Hartsfield-Jackson Atlanta International Airport: 574 (-9)
- SEA – Seattle/Tacoma International Airport: 575 (+2)
Large Airports (10-32.9M pax annually)
Top 5
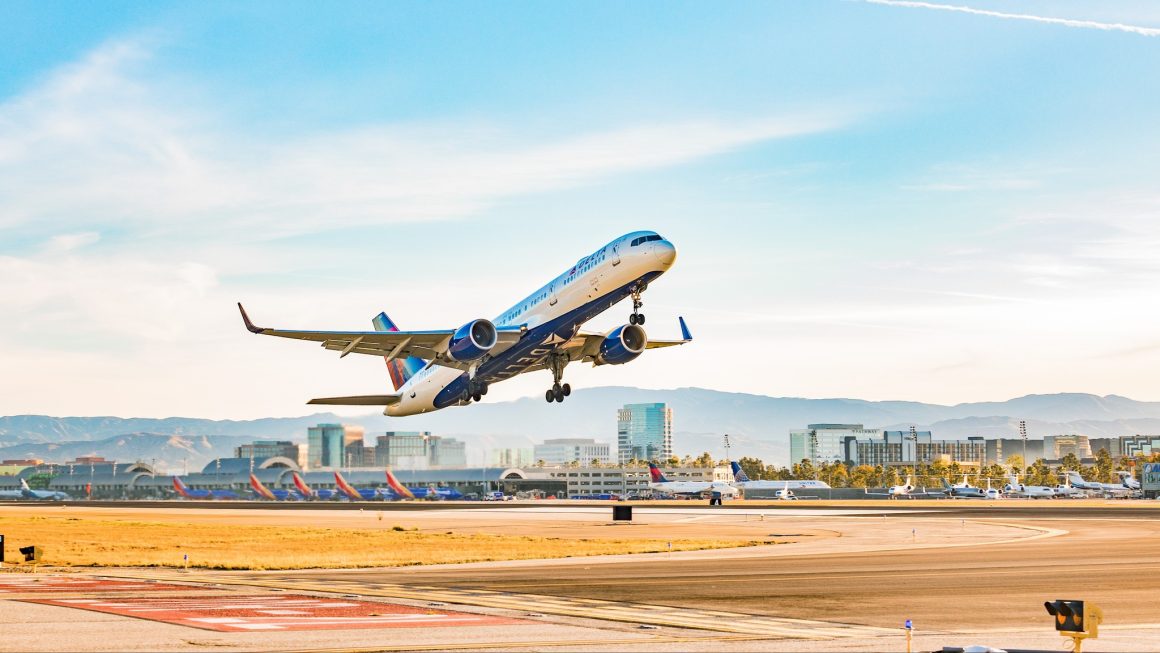
- SNA – John Wayne Airport, Orange County: 687 (+1)
- TPA – Tampa International Airport: 685 (-1)
- MCI – Kansas City International Airport: 683 (+10)
- DAL – Dallas Love Field: 675 (+/- 0)
- BNA – Nashville International Airport: 668 (+6)
Bottom 5
- PHL – Philadelphia International Airport: 541 (+/- 0)
- YUL – Montreal-Pierre Elliott Trudeau International Airport: 576 (-1)
- STL – St. Louis Lambert International Airport: 583 (-3)
- HNL – Honolulu International Airport: 593 (+2)
- MDW – Chicago Midway International Airport: 598 (-4)
Medium Airports (4.5-9.9M pax annually)
Top 5
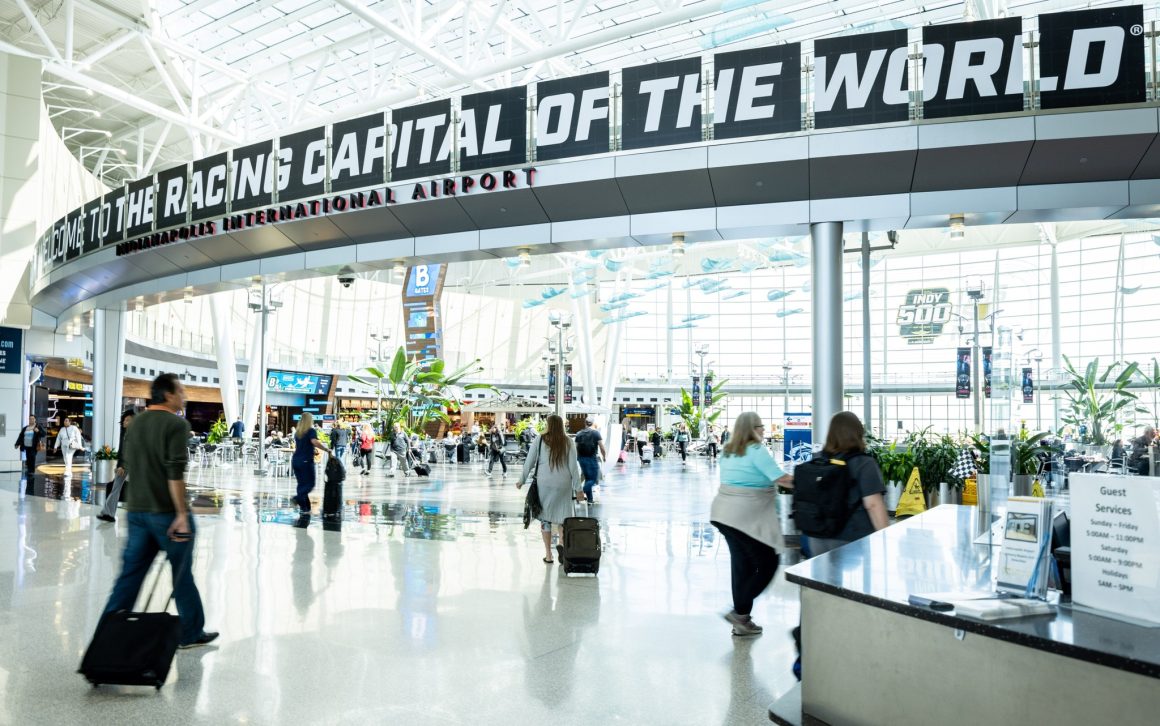
- IND – Indianapolis International Airport: 687 (+/- 0)
- JAX – Jacksonville International Airport: 686 (+4)
- RSW – Southwest Florida International Airport: 675 (-1)
- ONT – Ontario International Airport: 672 (-1)
- BUF – Buffalo Niagara International Airport: 670 (+3)
Bottom 5
- CLE – Cleveland Hopkins International Airport: 580 (-3)
- PIT – Pittsburgh International Airport: 625 (-5)
- BUR – Hollywood Burbank Airport: 626 (+1)
- ABQ – Albuquerque International Sunport: 646 (-8)
- OMA – Eppley Airfield: 653 (+/- 0)
Finding Enjoyment in the Journey
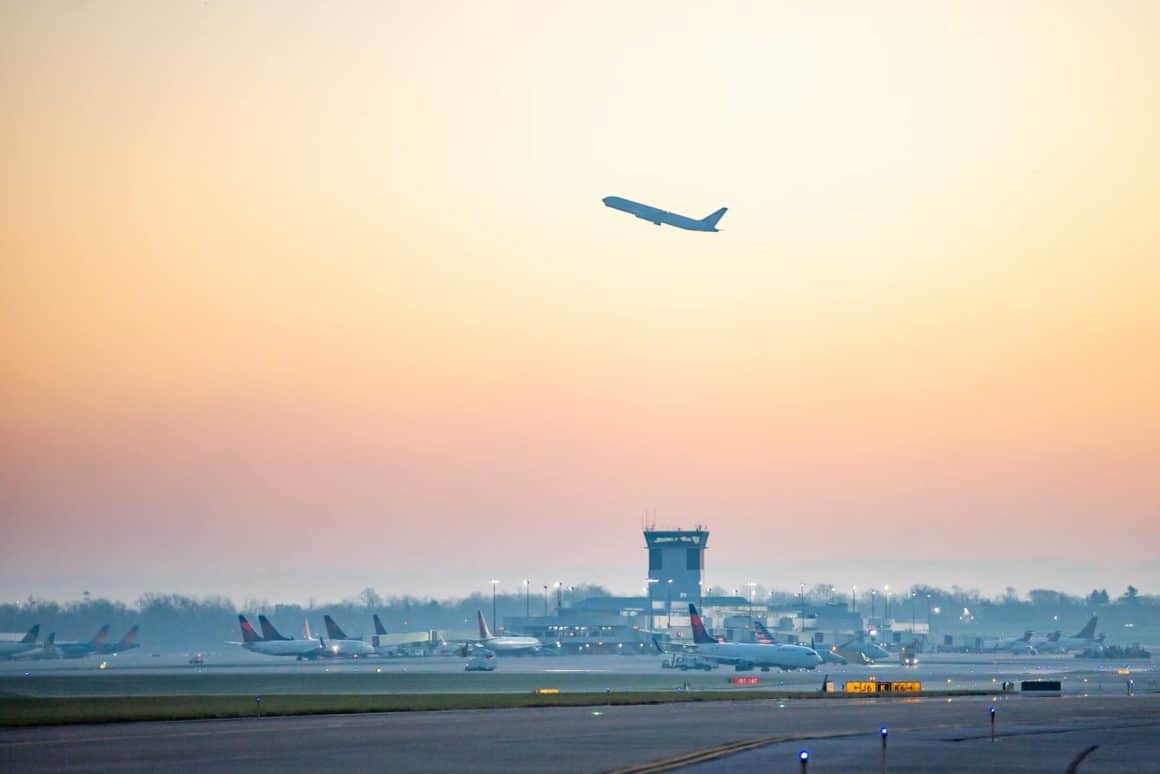
Amid rising costs and record-breaking crowds, travelers continue to find moments of enjoyment in their airport experiences. Stepping into an airport brings a familiar buzz–baggage wheels clicking, the aroma of fresh coffee, and the joy of watching planes take off all contribute to the experience.
So, while rising costs may trim a few dollars off the airport shopping spree, one thing is clear: the airport experience itself is holding steady.
Moving forward, airports will need to strike a balance between managing growing passenger numbers and maintaining the high standards that keep travelers satisfied.
Do you agree with the latest rankings? You can find out how your favorite (or not-so-favorite) airport performed by checking out the complete list in the J.D. Power 2024 North America Airport Satisfaction Study.
