Good News for the Airlines and Travelers Alike
Many of us AvGeeks are tracking the progress of the passenger counts supplied by the Transportation Security Administration during the COVID pandemic. Avid numbers geeks also know that raw data should always be converted to associated cool charts!
Numbers in the Raw
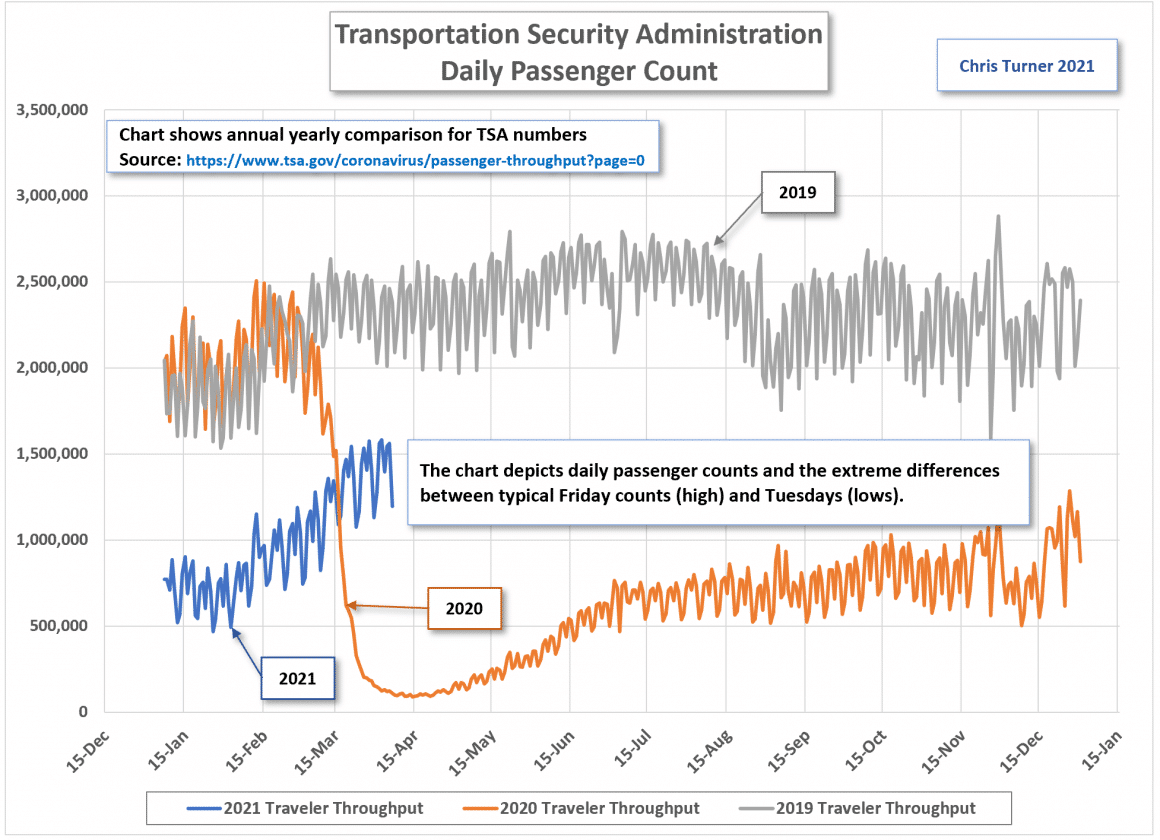
The first chart below displays the raw data. Because the TSA lists the most current day first, the chart reconstructs a chronological visualization for the same time periods January – December.
Making Sense of It All
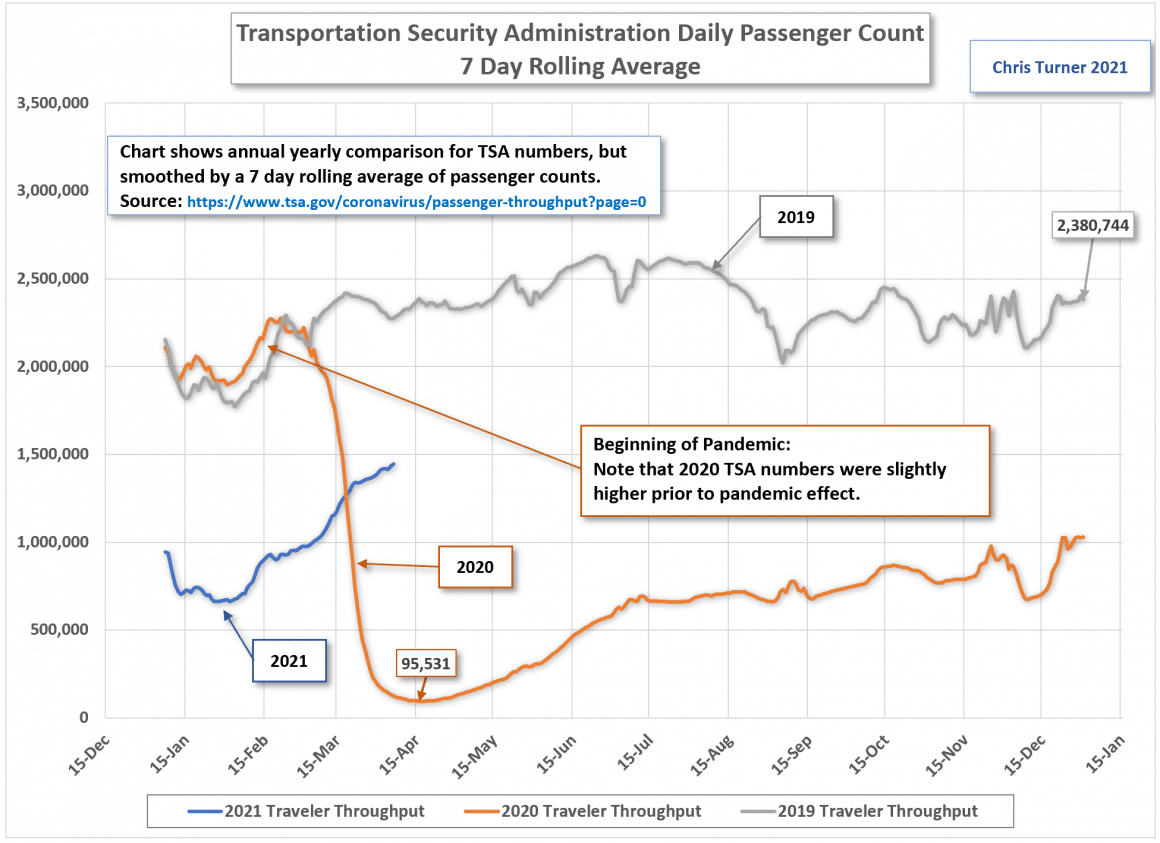
Well aren’t those some squiggly lines? Because these are daily points, the lines show large amplitudes that correlate to high traffic (Fridays) and low traffic (Tuesdays). Let’s smooth out the lines using a rolling 7 day average to provide a better picture.
Deriving Some Encouraging Conclusions
The 7 day chart shows some interesting facts. The first part of 2020 on a rolling average basis, had approximately 5% increase in traffic over 2019 (grey line). The precipitous drop from February to April highlights the extent to which passenger traffic decreased. One could follow the 2020 line from right and then see the 2021 line in Blue to left as a continuation. Although 2021 began at less than 50 percent traffic compared to 2020, passenger counts have rapidly increased since January 2021.
Playing the Percentages
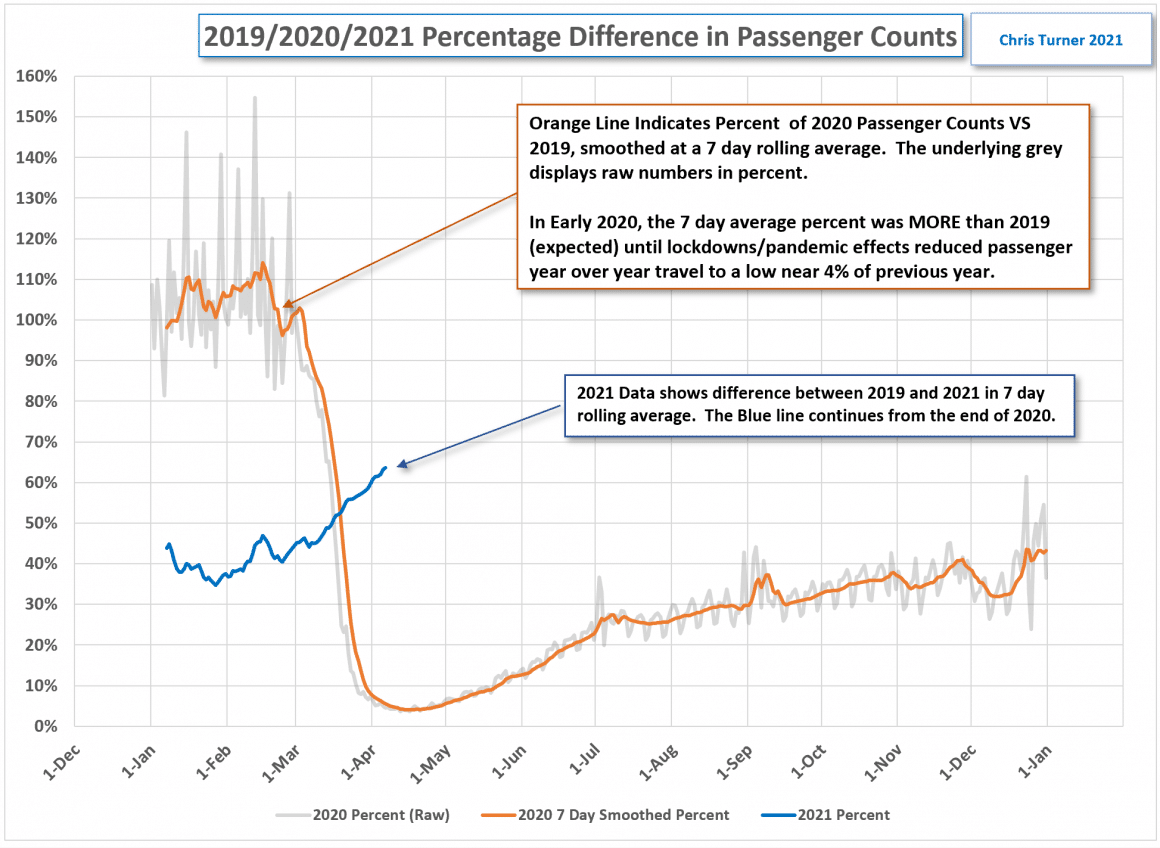
Speaking of percentages, the chart below indicates the raw percentage differences and a smoothed 7 day average. Note that there are only 2 lines – the orange line is the difference between 2019 and 2020. The blue 2021 line shows the difference between 2019 and 2021.
A What-If Scenario
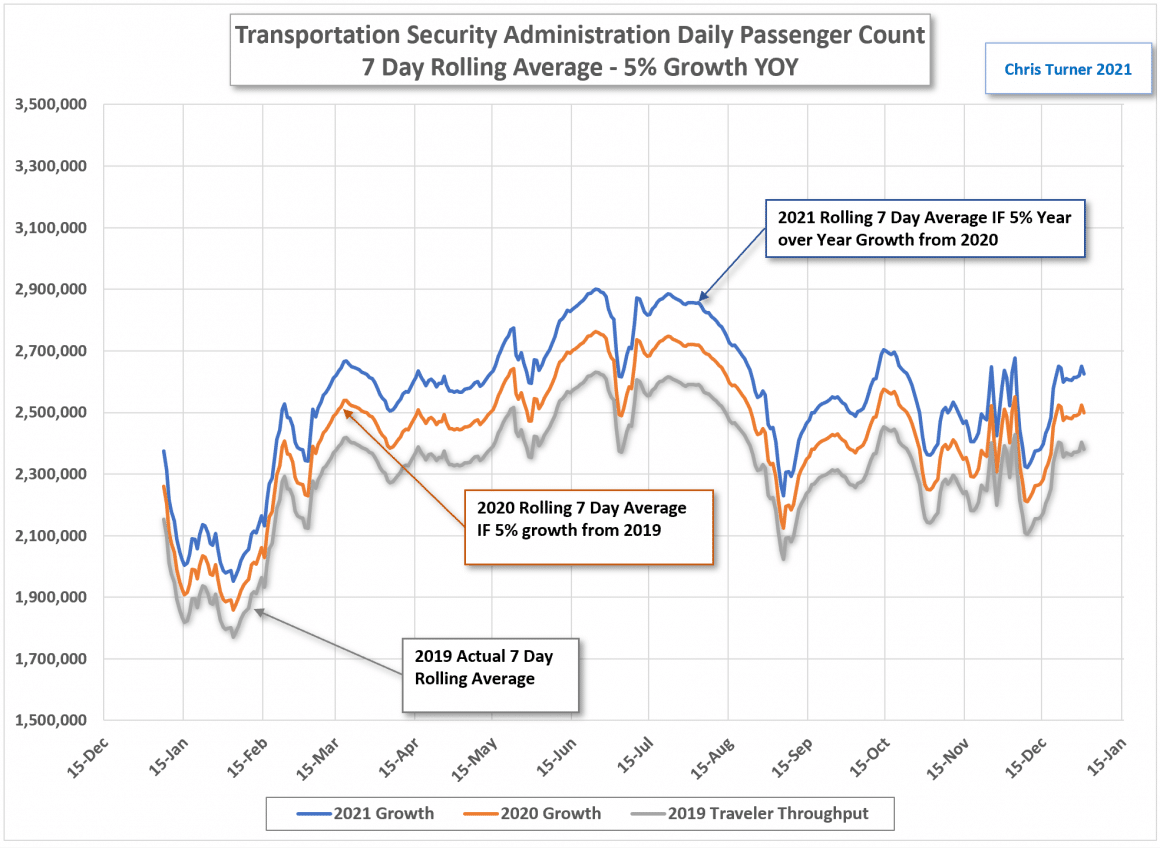
When trying to identify when normalcy will return, Here’s a “what if” scenario: What if passenger traffic grew by 5% year over year from 2019 to 2020 through 2021?
Lost Passengers
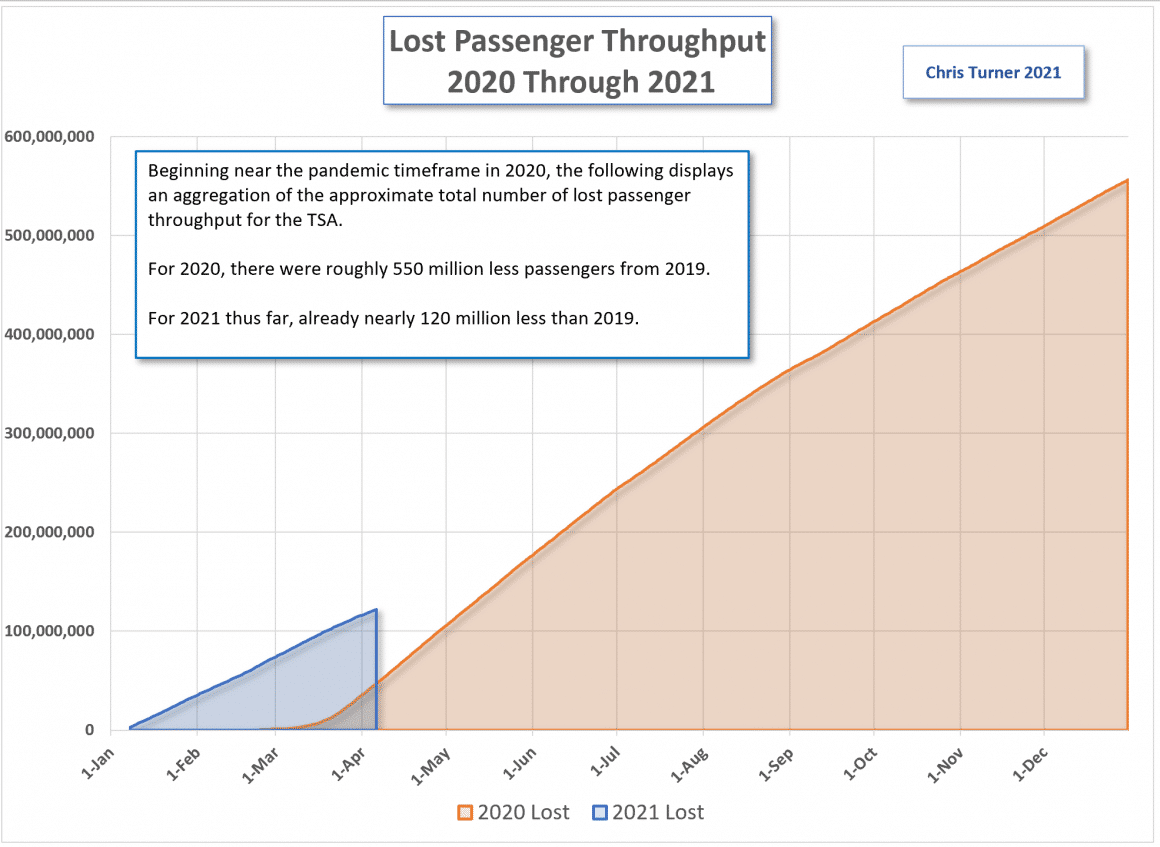
What would be the point in identifying where passenger traffic might be at 5% growth? That answer rests in the below graph that shows the approximate “lost passenger counts” due to pandemic.
Some Bad/Good News
In just over a year, roughly 600,000,000 passengers did not travel. But if the 2021 pace of passenger counts continues, by August we could surpass 2019! That would be GREAT news for the aviation industry!
